Jeff Buchbinder | Chief Equity Strategist
Stocks have had a tremendous run since last fall (at least until yesterday), with four straight positive months, a series of record highs for the S&P 500, and, finally, one for the Nasdaq, and a more than 20% advance for both indexes.
When stocks do this well, we inevitably hear warnings about high valuations from strategists and pundits. For LPL Research, valuations and corporate fundamentals are major inputs into asset allocation decisions, so this is not intended to dismiss its importance. But good investment decisions, particularly over the short-to-intermediate term, are more comprehensive and incorporate several different disciplines — including technical analysis, in our opinion. Why is that so important? A big reason is traditional valuation metrics have historically not been good indicators of short-term performance.
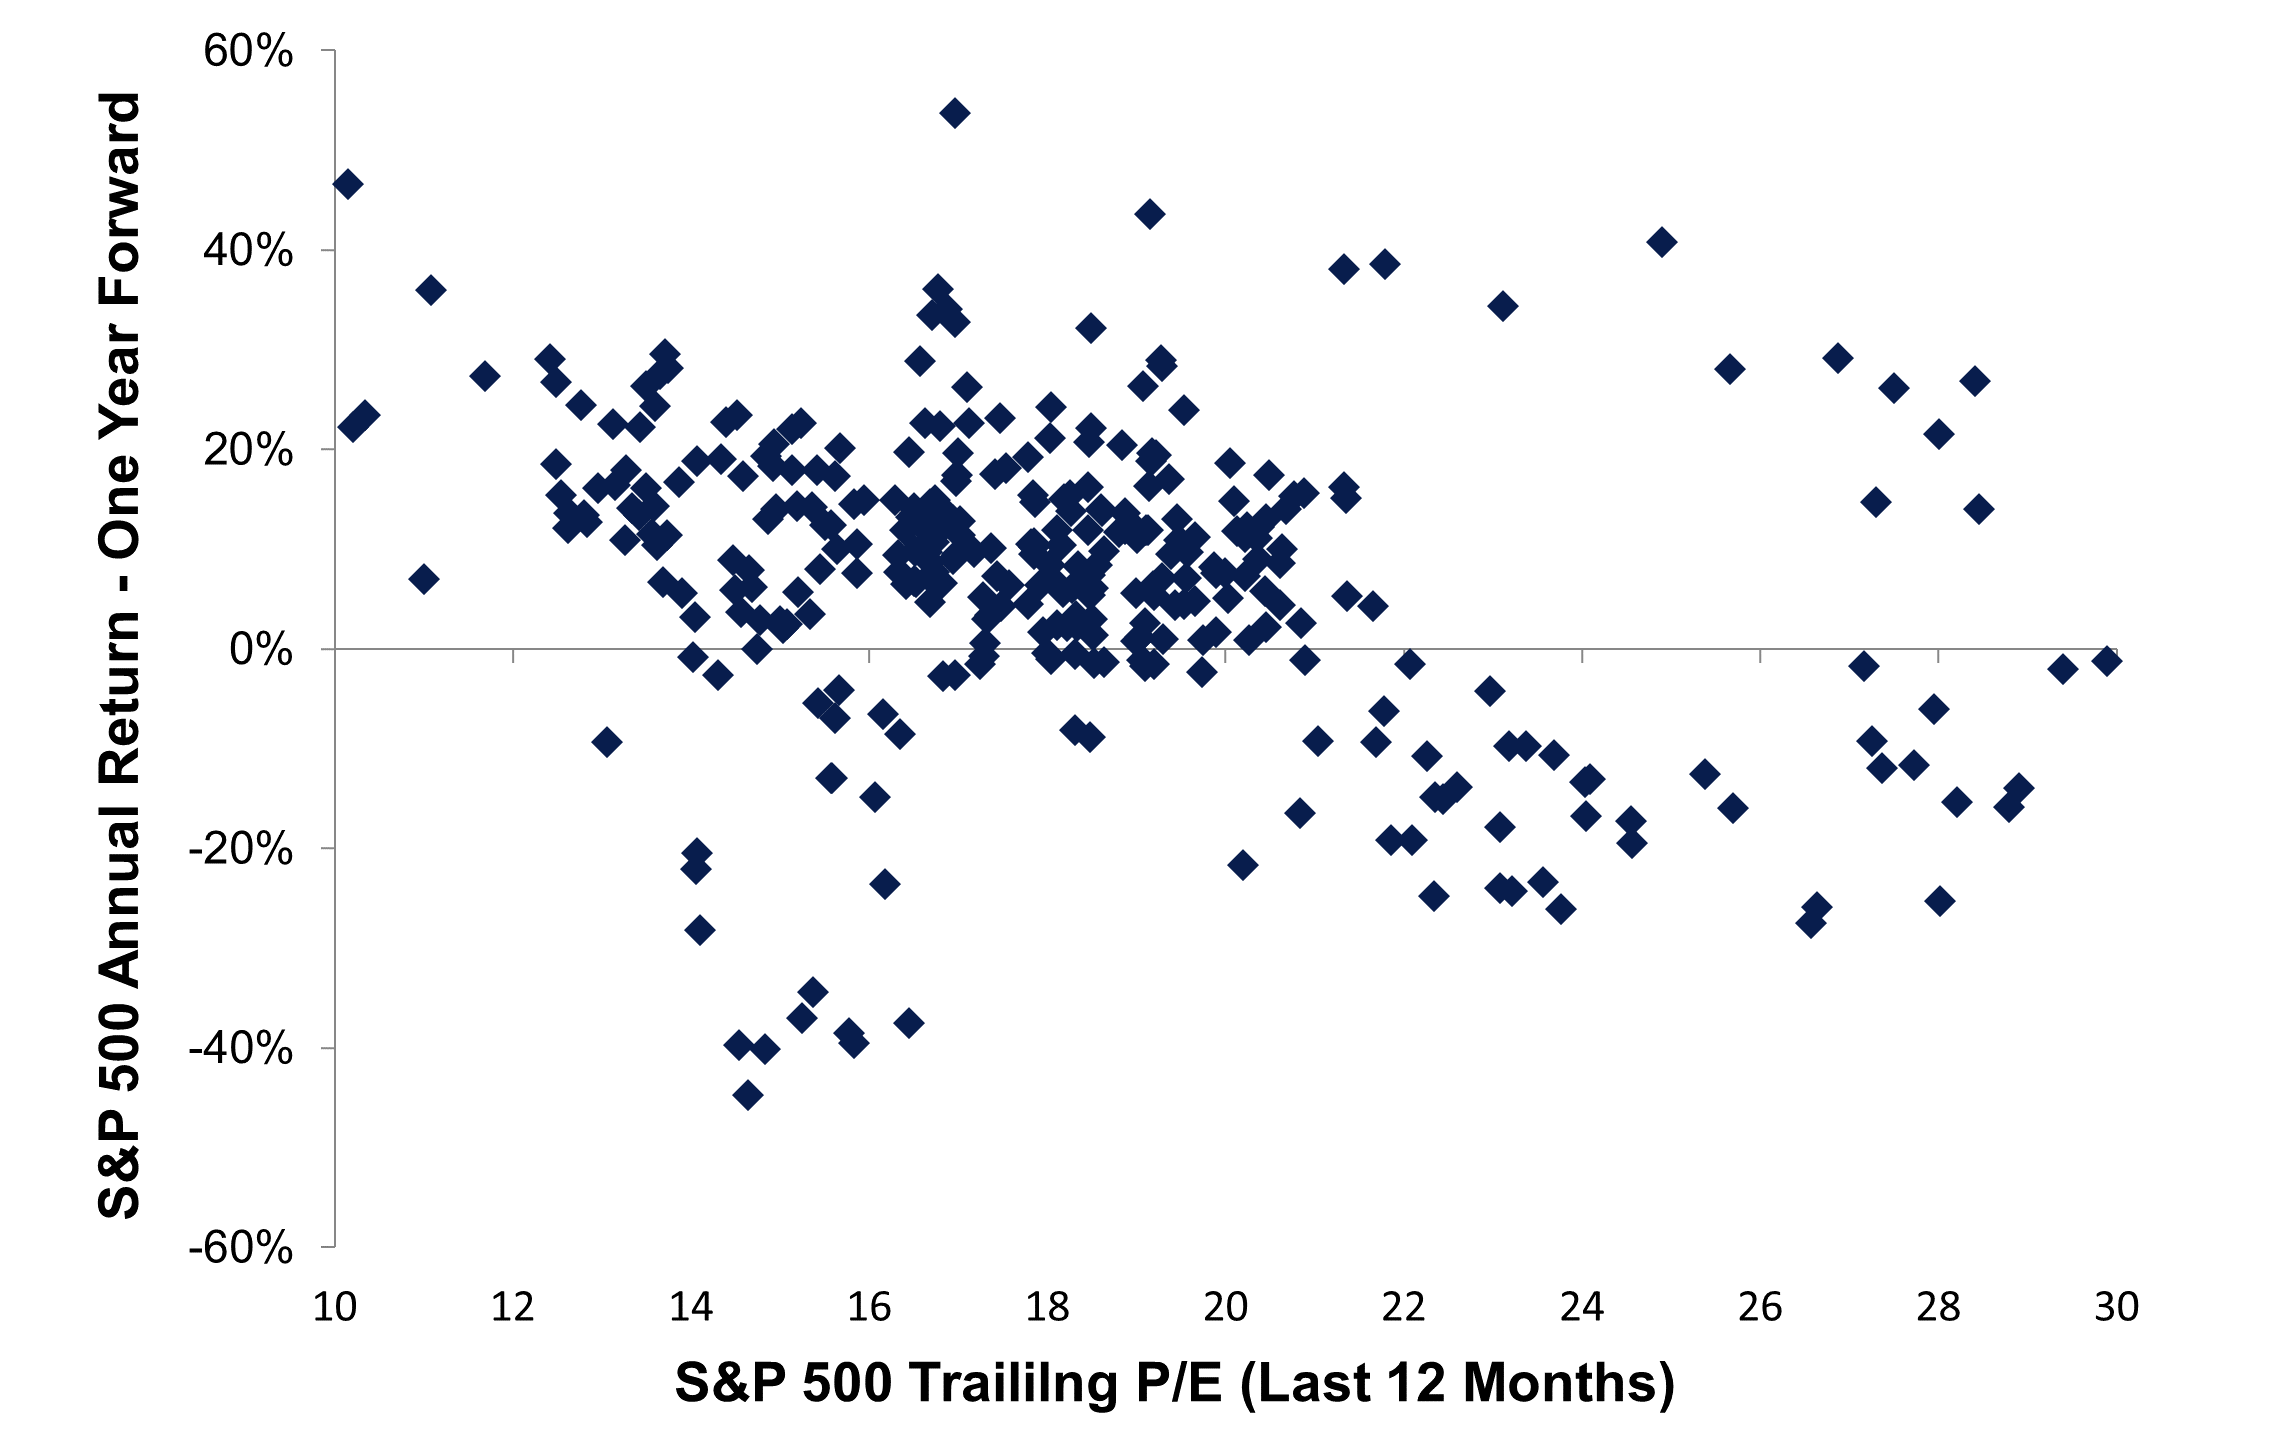
A scatterplot chart with the S&P 500 Index price-to-earnings ratio (P/E) on the horizontal (x) axis and subsequent one-year return on the vertical (y) axis illustrates this point. If this relationship was well correlated, then the dots would form a downward-sloping pattern from upper left to lower right, indicating higher valuations precede lower returns, and vice versa.
But this scatterplot, including data back to 1990, shows no relationship whatsoever. Essentially, P/E offers very little insight into whether stocks will do well or not in the coming year.
P/E Ratios Have Not Historically Been Good Predictors of One-Year Performance

Source: LPL Research, FactSet 03/05/24
Disclosures: Indexes are unmanaged and cannot be invested in directly. Past performance is no guarantee of future results.
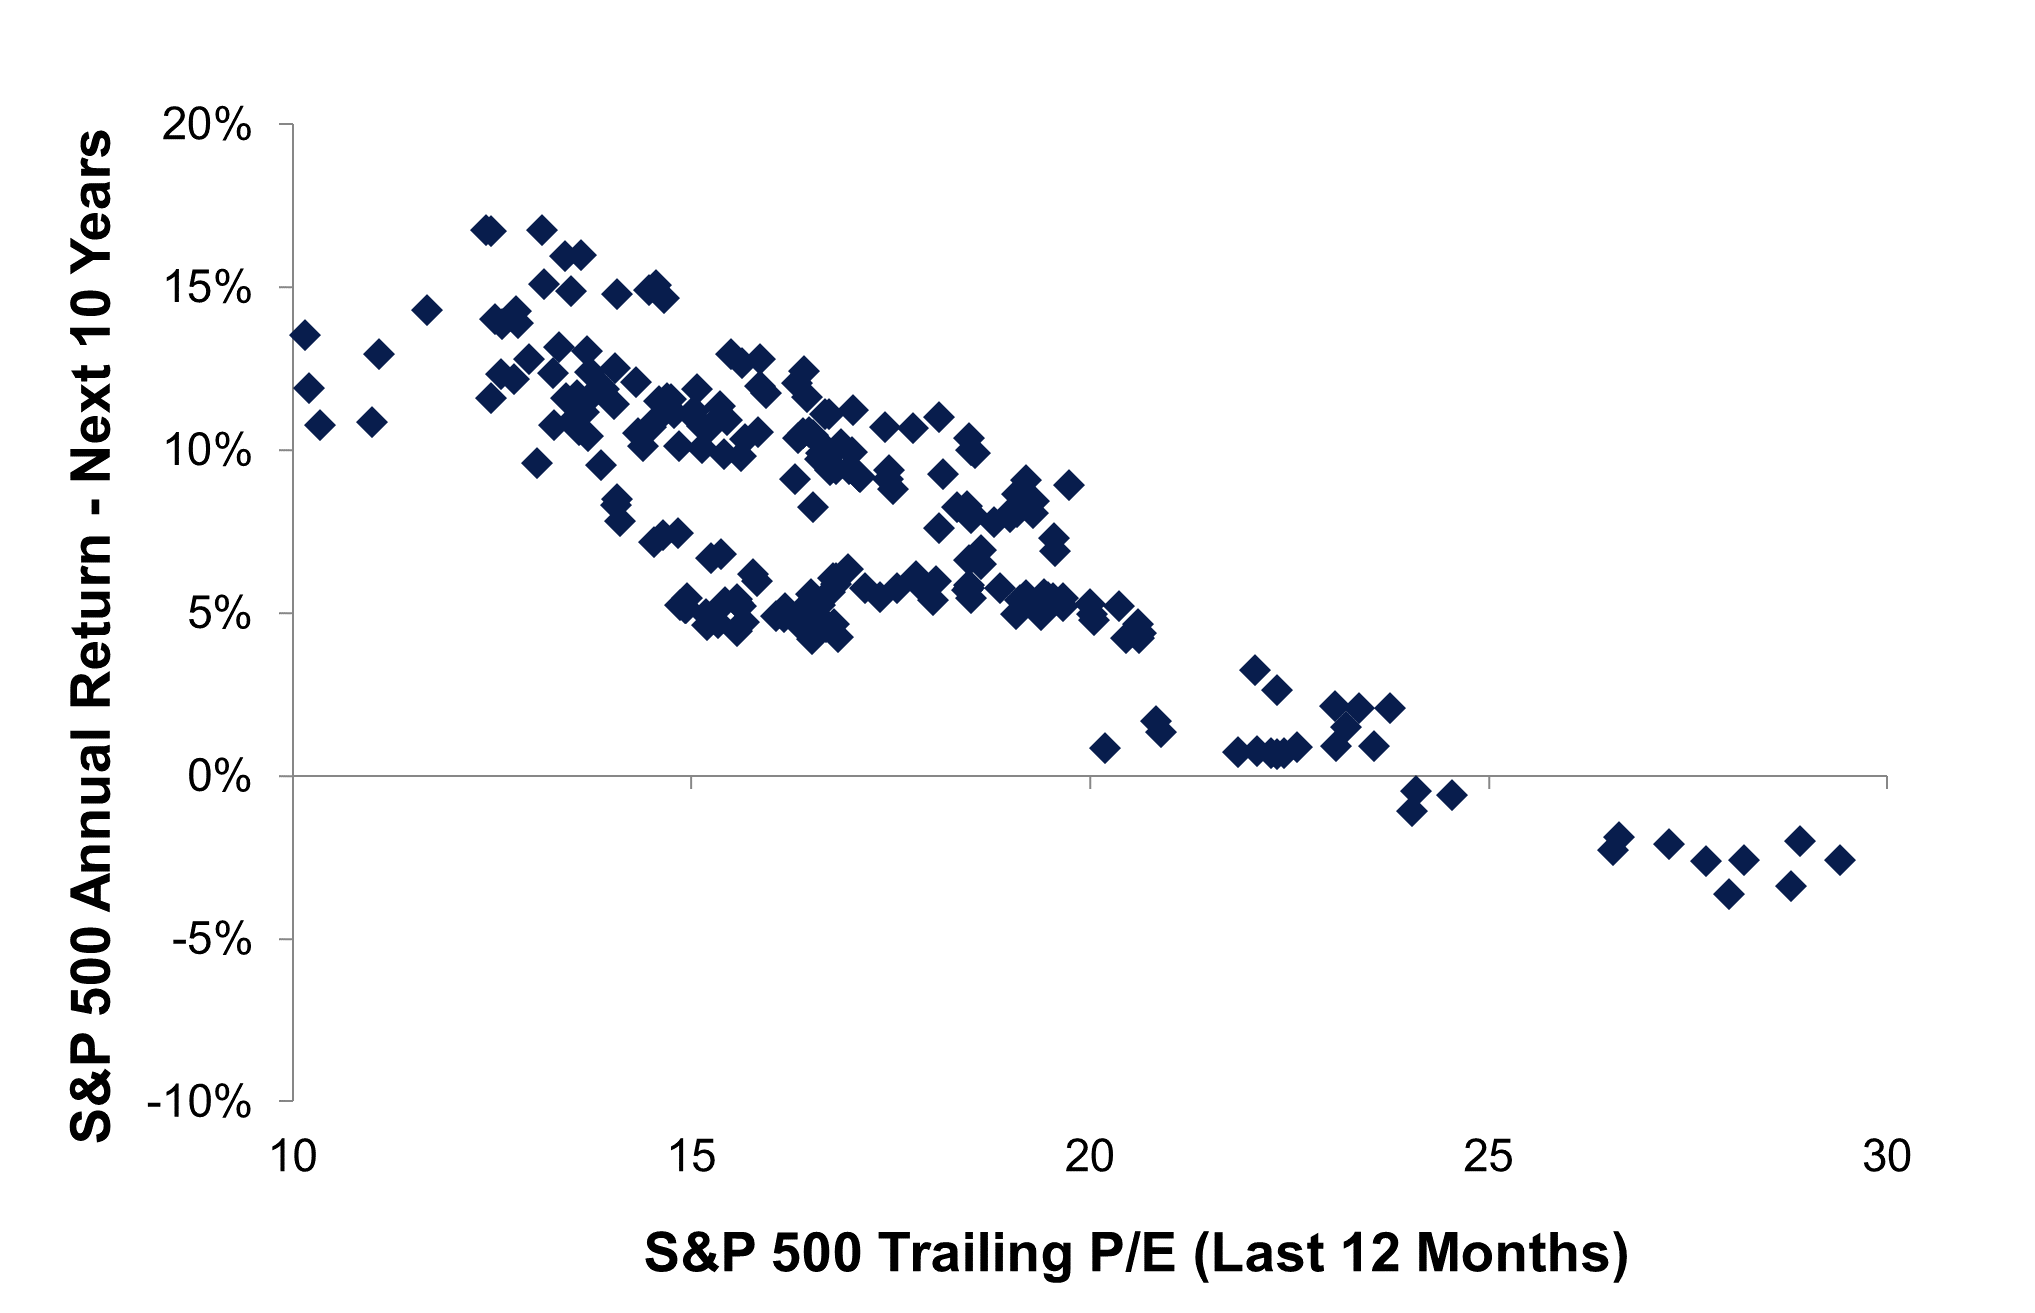
If you are searching for the downward-sloping chart pattern described above, where higher valuations precede lower returns and vice versa, you need only extend the time horizon. When comparing P/E to subsequent 10-year returns, you will notice that predictive pattern — the dots start in the upper left quadrant with low P/Es preceding higher returns, and move to the lower right quadrant, signifying higher P/Es, and lower subsequent returns. In other words, valuations are important for long-term buy-and-hold investors, but not so much for traders or your typical tactical asset allocator.
The current P/E for the S&P 500 is near 23 on a trailing 12-month basis and suggests modest, low-to-mid-single-digit returns over on the next decade. That forecast may end up being overly pessimistic given the potential for a further structural shift higher in valuations as in prior decades, but it does suggest that another decade of double-digit annualized returns, which investors have enjoyed over the past 10 years, is unlikely.
P/E Ratios Have Historically Been Excellent Predictors of Ten-Year Performance

Source: LPL Research, FactSet 03/05/24
Disclosures: Indexes are unmanaged and cannot be invested in directly. Past performance is no guarantee of future results.
Tying this example to the current environment, our message is this. Stock valuations are clearly elevated, especially technology stocks benefiting from the artificial intelligence boom. We’re probably overdue for a pullback. But fundamentals are quite good right now, so these elevated valuations may persist throughout 2024 and potentially even longer. (We wrote about big-cap technology company earnings in our March 4, 2024 Weekly Market Commentary.)
That leaves us watching technical indicators for signs of a breakdown in this market’s uptrend and looking for evidence of fundamental deterioration, which has not yet materialized. In the meantime, LPL Research recommends staying invested and maintains its neutral tactical stance on equities.
IMPORTANT DISCLOSURES
This material is for general information only and is not intended to provide specific advice or recommendations for any individual. There is no assurance that the views or strategies discussed are suitable for all investors. To determine which investment(s) may be appropriate for you, please consult your financial professional prior to investing.
Investing involves risks including possible loss of principal. No investment strategy or risk management technique can guarantee return or eliminate risk.
Indexes are unmanaged and cannot be invested into directly. Index performance is not indicative of the performance of any investment and does not reflect fees, expenses, or sales charges. All performance referenced is historical and is no guarantee of future results.
This material was prepared by LPL Financial, LLC. All information is believed to be from reliable sources; however LPL Financial makes no representation as to its completeness or accuracy.
Unless otherwise stated LPL Financial and the third party persons and firms mentioned are not affiliates of each other and make no representation with respect to each other. Any company names noted herein are for educational purposes only and not an indication of trading intent or a solicitation of their products or services.
Asset Class Disclosures –
International investing involves special risks such as currency fluctuation and political instability and may not be suitable for all investors. These risks are often heightened for investments in emerging markets.
Bonds are subject to market and interest rate risk if sold prior to maturity.
Municipal bonds are subject and market and interest rate risk and potentially capital gains tax if sold prior to maturity. Interest income may be subject to the alternative minimum tax. Municipal bonds are federally tax-free but other state and local taxes may apply.
Preferred stock dividends are paid at the discretion of the issuing company. Preferred stocks are subject to interest rate and credit risk. They may be subject to a call features.
Alternative investments may not be suitable for all investors and involve special risks such as leveraging the investment, potential adverse market forces, regulatory changes and potentially illiquidity. The strategies employed in the management of alternative investments may accelerate the velocity of potential losses.
Mortgage backed securities are subject to credit, default, prepayment, extension, market and interest rate risk.
High yield/junk bonds (grade BB or below) are below investment grade securities, and are subject to higher interest rate, credit, and liquidity risks than those graded BBB and above. They generally should be part of a diversified portfolio for sophisticated investors.
Precious metal investing involves greater fluctuation and potential for losses.
The fast price swings of commodities will result in significant volatility in an investor’s holdings.
Securities and advisory services offered through LPL Financial, a registered investment advisor and broker-dealer. Member FINRA/SIPC.
Not Insured by FDIC/NCUA or Any Other Government Agency | Not Bank/Credit Union Deposits or Obligations | Not Bank/Credit Union Guaranteed | May Lose Value