Adam Turnquist | Chief Technical Strategist
The recent technical progress on the Equal Weight S&P 500 (SPW) has been overshadowed, as only four stocks, including NVIDIA (NVDA), have accounted for more than half of the S&P 500’s total return this year, with NVIDIA alone contributing about one-quarter. As the name implies, each stock on the SPW is equally weighted, as opposed to the market-cap-weighted S&P 500 Index (SPX). The equal weighting eliminates the distortion of the mega cap components and significantly changes several sector weightings, including technology, which drops from around 30% on the SPX to only 13% on the SPW. The industrials sector has the largest increase in weighting, jumping from 9% on the SPX to nearly 16% on the SPW.
The chart below highlights the improving technical setup for the SPW. After a brief consolidation phase following a sizable rally into year end, the index has climbed above resistance from the 2023 highs. The recent breakout from the bullish flag pattern, coupled with positive momentum, suggests a retest of the January 2022 record high of 6,665 is likely.
Equal Weight S&P 500 Approaching Record-High Territory

Source: LPL Research, Bloomberg 02/22/24
Disclosures: All indexes are unmanaged and cannot be invested in directly. Past performance is no guarantee of future results.
It’s All Relative
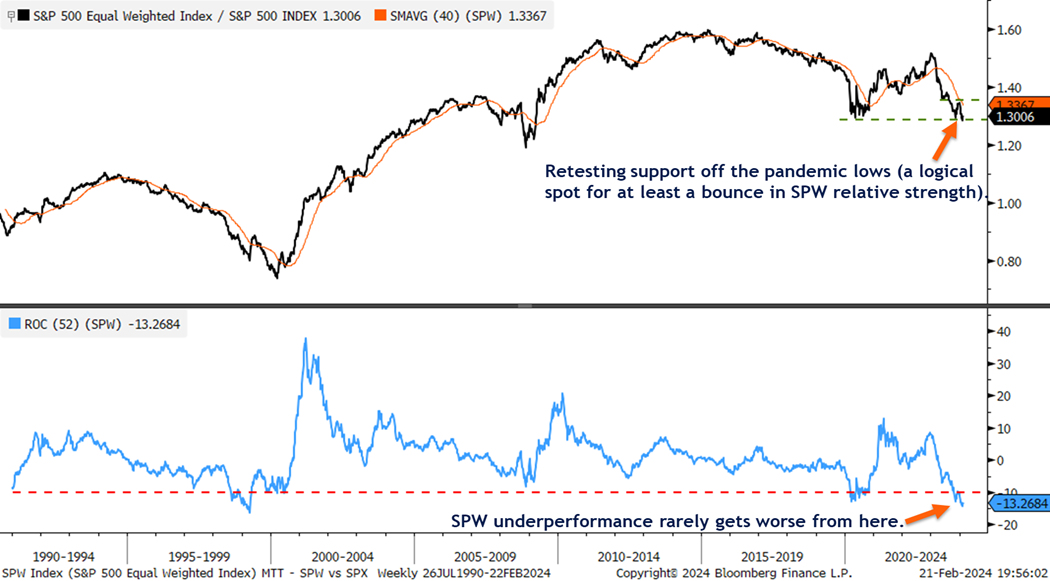
While the SPW is making technical progress in absolute terms, its relative strength compared to the broader market has been underwhelming. The chart below compares both indexes in a ratio chart, used to identify relative trend direction and strength. When the ratio chart is rising, the SPW is outperforming the SPX, and vice versa when it is declining.
Currently, the ratio chart remains in a downtrend but is near a key support level dating to the pandemic-era lows. Furthermore, and as highlighted in the bottom panel, the 52-week rate of change (ROC) for the pair recently dropped to -13%, a historically low level only exceeded in April 1999. Given the stretched rate of change to the downside and the fact that the SPW vs. SPX ratio chart is at a key support level, LPL Research suspects this could be a logical spot for at least a rebound in SPW relative strength.
Equal Weight S&P 500 vs. Market-Cap-Weighted S&P 500

Source: LPL Research, Bloomberg 02/22/24
Disclosures: All indexes are unmanaged and cannot be invested in directly. Past performance is no guarantee of future results.
Summary
A rebound in relative strength for the SPW does not automatically mean the SPX will trade lower, although it would likely come at the expense of mega cap leadership, which may be due for a breather from the heavy lifting these stocks have done for the market over the last year. In addition, technical progress and improving relative strength for the SPW suggest the average S&P 500 stock is doing quite well and that the market is broadening beyond the closely followed mega-caps.
IMPORTANT DISCLOSURES
This material is for general information only and is not intended to provide specific advice or recommendations for any individual. There is no assurance that the views or strategies discussed are suitable for all investors. To determine which investment(s) may be appropriate for you, please consult your financial professional prior to investing.
Investing involves risks including possible loss of principal. No investment strategy or risk management technique can guarantee return or eliminate risk.
Indexes are unmanaged and cannot be invested into directly. Index performance is not indicative of the performance of any investment and does not reflect fees, expenses, or sales charges. All performance referenced is historical and is no guarantee of future results.
This material was prepared by LPL Financial, LLC. All information is believed to be from reliable sources; however LPL Financial makes no representation as to its completeness or accuracy.
Unless otherwise stated LPL Financial and the third party persons and firms mentioned are not affiliates of each other and make no representation with respect to each other. Any company names noted herein are for educational purposes only and not an indication of trading intent or a solicitation of their products or services.
Asset Class Disclosures –
International investing involves special risks such as currency fluctuation and political instability and may not be suitable for all investors. These risks are often heightened for investments in emerging markets.
Bonds are subject to market and interest rate risk if sold prior to maturity.
Municipal bonds are subject and market and interest rate risk and potentially capital gains tax if sold prior to maturity. Interest income may be subject to the alternative minimum tax. Municipal bonds are federally tax-free but other state and local taxes may apply.
Preferred stock dividends are paid at the discretion of the issuing company. Preferred stocks are subject to interest rate and credit risk. They may be subject to a call features.
Alternative investments may not be suitable for all investors and involve special risks such as leveraging the investment, potential adverse market forces, regulatory changes and potentially illiquidity. The strategies employed in the management of alternative investments may accelerate the velocity of potential losses.
Mortgage backed securities are subject to credit, default, prepayment, extension, market and interest rate risk.
High yield/junk bonds (grade BB or below) are below investment grade securities, and are subject to higher interest rate, credit, and liquidity risks than those graded BBB and above. They generally should be part of a diversified portfolio for sophisticated investors.
Precious metal investing involves greater fluctuation and potential for losses.
The fast price swings of commodities will result in significant volatility in an investor’s holdings.
Securities and advisory services offered through LPL Financial, a registered investment advisor and broker-dealer. Member FINRA/SIPC.
Not Insured by FDIC/NCUA or Any Other Government Agency | Not Bank/Credit Union Deposits or Obligations | Not Bank/Credit Union Guaranteed | May Lose Value