Adam Turnquist | Chief Technical Strategist
Key Takeaways
- After over a 500-trading day wait, the S&P 500 is on the cusp of breaking out to a new record high.
- Historically, the market has posted average 12-month-forward returns of 11.7% after reaching a new high for the first time in at least a year.
- The technical setup for stocks remains bullish, and the selling pressure that started the year helped reset historically overbought market conditions.
- Breadth has notably broadened out with cyclical leadership intact, while the macro backdrop appears relatively less complicated compared to 2023.
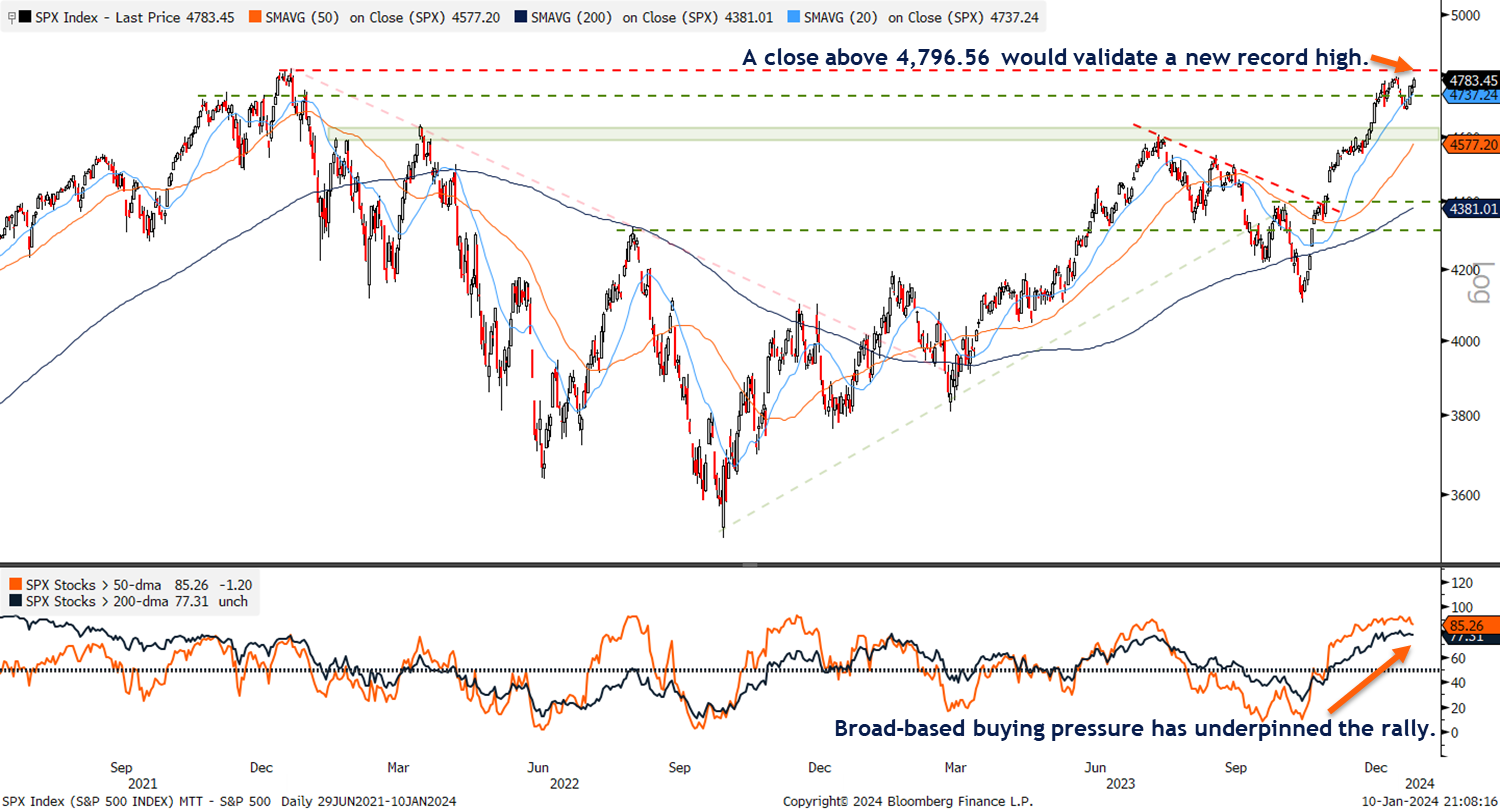
While severe weather watch alerts sweep across many parts of the U.S. this week, a record-high watch is now in effect for the S&P 500. The index rose 0.6% yesterday, closing only 13 points away from its January 3, 2022, record-high close of 4,796.56. In the event of a breakout, the next resistance level to watch sets up at the S&P 500’s intraday record high of 4,819. Support for the broader market sits at 4,737 (20-day moving average) and the 4,690 – 4,700 range (late 2021 highs/recent January lows).
Building participation off the October correction lows has underpinned the recovery. As highlighted in the bottom panel of the chart below, over three-quarters of S&P 500 stocks are trading above their 50- and 200-day moving averages. Moreover, the composition of breadth remains bullish as participation among the offensive sectors continues to outpace the defensive sectors.
The S&P 500 is Closing in on Record Highs

Source: LPL Research, Bloomberg 01/10/24
Disclosures: Past performance is no guarantee of future results. All indexes are unmanaged and can’t be invested in directly.
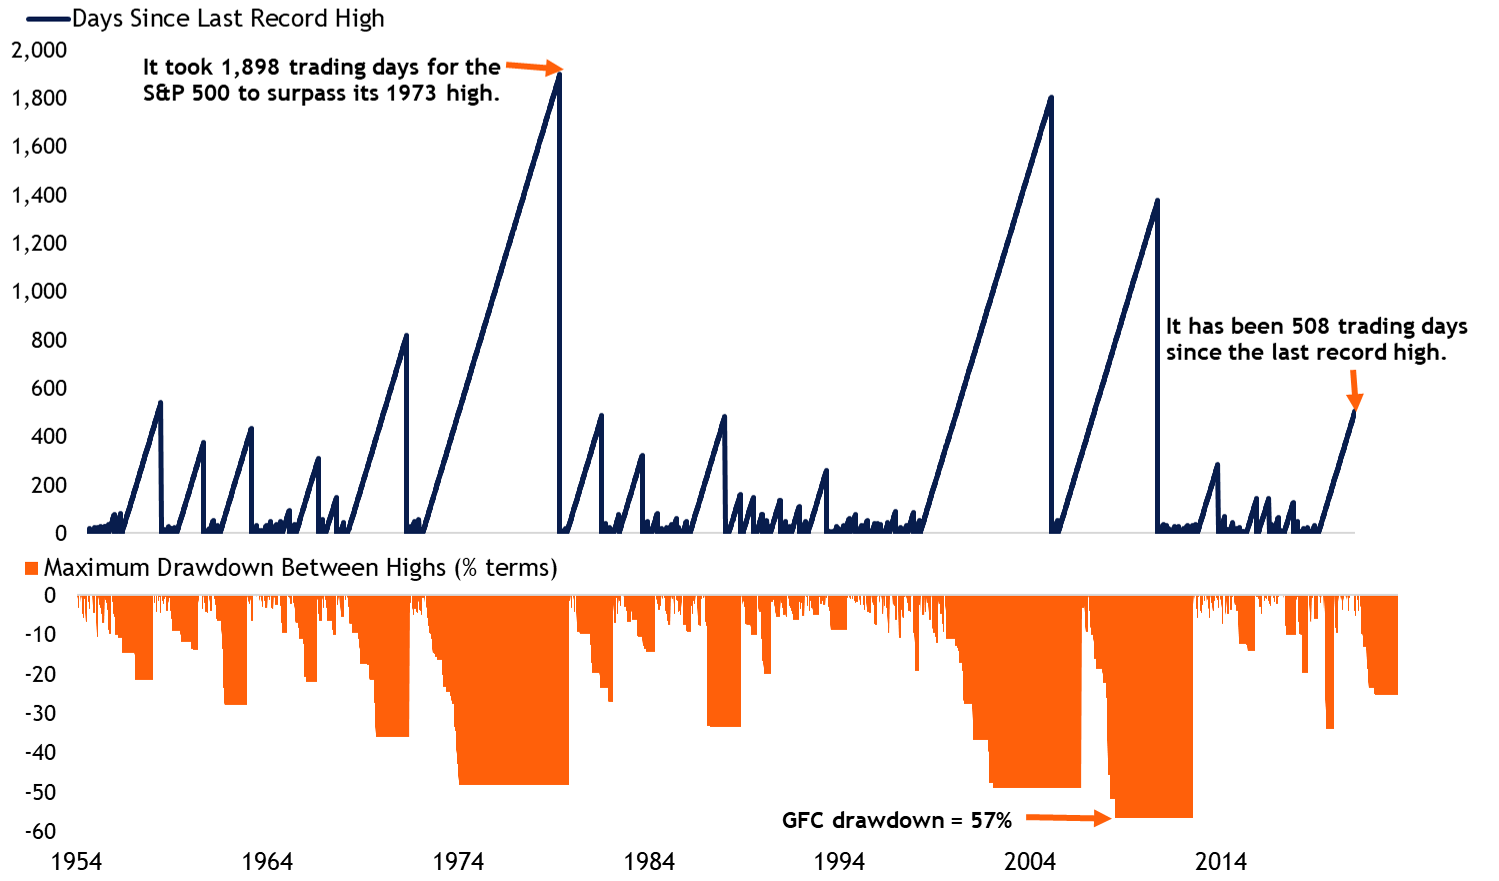
Investors have been waiting for over 500 trading days to celebrate a new high for the S&P 500. While for many, it may feel like an eternity, especially after such a volatile 2022, it could be worse when putting the current period into historical context. The chart below breaks down the total number of trading days between record highs for the S&P 500 and the drawdowns incurred during each period. The chart begins in 1954 to deliberately exclude the Great Depression-era outlier of 6,249 trading days to recapture the highs set in 1929. Outside of that period, the current 508 trading-day wait ranks as the sixth-longest without a new high. In addition, the maximum drawdown since January 3, 2022, has been relatively shallow at 25%. This compares to the largest S&P 500 drawdown between new highs of 57% incurred during the Global Financial Crisis (GFC).
S&P 500 Trading Days and Drawdowns Between Record Highs

Source: LPL Research, Bloomberg 01/10/24
Disclosures: Past performance is no guarantee of future results. All indexes are unmanaged and can’t be invested in directly. The modern design of the S&P 500 stock index was first launched in 1957. Performance back to 1950 incorporates the performance of the predecessor index, the S&P 90.
If the market can make a new high, the next obvious question from investors is, what happens next? As the saying goes, momentum often begets momentum, an adage also supported by historical price action. The table below highlights periods when the S&P 500 took at least one year, or 252 trading days, to post a new record high. Forward 12-month S&P 500 returns after a new record high was reached averaged 11.7%, with 92.3% of periods producing a positive return.
Good Things Come to Those Who Wait
Periods With at Least One Year Between New S&P 500 Highs
| Date of Previous Record High | Date of New Record High | Trading Days Between Highs | Maximum Drawdown | 12-Month Forward Return |
| 1/11/1973 | 7/17/1980 | 1,898 | -48.2% | 7.7% |
| 3/24/2000 | 5/30/2007 | 1,803 | -49.1% | -8.5% |
| 10/9/2007 | 3/28/2013 | 1,376 | -56.8% | 18.4% |
| 11/29/1968 | 3/6/1972 | 820 | -36.1% | 4.9% |
| 8/2/1956 | 9/24/1958 | 540 | -21.6% | 14.1% |
| 1/3/2022 | ? | 508* | -25.5%* | – |
| 11/28/1980 | 11/3/1982 | 488 | -27.1% | 14.4% |
| 8/25/1987 | 7/26/1989 | 485 | -33.5% | 5.3% |
| 12/12/1961 | 9/3/1963 | 434 | -28.0% | 13.6% |
| 8/3/1959 | 1/27/1961 | 375 | -13.9% | 11.3% |
| 10/10/1983 | 1/21/1985 | 324 | -14.4% | 17.4% |
| 2/9/1966 | 5/4/1967 | 310 | -22.2% | 4.6% |
| 5/21/2015 | 7/11/2016 | 286 | -14.2% | 13.5% |
| 2/2/1994 | 2/14/1995 | 260 | -8.9% | 35.9% |
| Average | 11.7% | |||
| Median | 13.5% | |||
| Percent Positive | 92.30% |
*Ongoing
Source: LPL Research, Bloomberg 01/10/24
Disclosures: Past performance is no guarantee of future results. All indexes are unmanaged and can’t be invested in directly. The modern design of the S&P 500 stock index was first launched in 1957. Performance back to 1950 incorporates the performance of the predecessor index, the S&P 90.
Summary
The S&P 500 is on the verge of breaking out to new highs following a 500-plus trading day drought since its last record high. Prolonged periods without a new high have historically produced double-digit 12-month gains once a record high is reached, pointing to solid potential gains this year if the S&P 500 can clear 4,797. The technical setup remains bullish, and the slow start for stocks this year helped reset historically overbought market conditions. Breadth has notably broadened out with cyclical leadership intact, while the macro backdrop appears relatively less complicated compared to 2023.
IMPORTANT DISCLOSURES
This material is for general information only and is not intended to provide specific advice or recommendations for any individual. There is no assurance that the views or strategies discussed are suitable for all investors. To determine which investment(s) may be appropriate for you, please consult your financial professional prior to investing.
Investing involves risks including possible loss of principal. No investment strategy or risk management technique can guarantee return or eliminate risk.
Indexes are unmanaged and cannot be invested into directly. Index performance is not indicative of the performance of any investment and does not reflect fees, expenses, or sales charges. All performance referenced is historical and is no guarantee of future results.
This material was prepared by LPL Financial, LLC. All information is believed to be from reliable sources; however LPL Financial makes no representation as to its completeness or accuracy.
Unless otherwise stated LPL Financial and the third party persons and firms mentioned are not affiliates of each other and make no representation with respect to each other. Any company names noted herein are for educational purposes only and not an indication of trading intent or a solicitation of their products or services.
Asset Class Disclosures –
International investing involves special risks such as currency fluctuation and political instability and may not be suitable for all investors. These risks are often heightened for investments in emerging markets.
Bonds are subject to market and interest rate risk if sold prior to maturity.
Municipal bonds are subject and market and interest rate risk and potentially capital gains tax if sold prior to maturity. Interest income may be subject to the alternative minimum tax. Municipal bonds are federally tax-free but other state and local taxes may apply.
Preferred stock dividends are paid at the discretion of the issuing company. Preferred stocks are subject to interest rate and credit risk. They may be subject to a call features.
Alternative investments may not be suitable for all investors and involve special risks such as leveraging the investment, potential adverse market forces, regulatory changes and potentially illiquidity. The strategies employed in the management of alternative investments may accelerate the velocity of potential losses.
Mortgage backed securities are subject to credit, default, prepayment, extension, market and interest rate risk.
High yield/junk bonds (grade BB or below) are below investment grade securities, and are subject to higher interest rate, credit, and liquidity risks than those graded BBB and above. They generally should be part of a diversified portfolio for sophisticated investors.
Precious metal investing involves greater fluctuation and potential for losses.
The fast price swings of commodities will result in significant volatility in an investor’s holdings.
Securities and advisory services offered through LPL Financial, a registered investment advisor and broker-dealer. Member FINRA/SIPC.
Not Insured by FDIC/NCUA or Any Other Government Agency | Not Bank/Credit Union Deposits or Obligations | Not Bank/Credit Union Guaranteed | May Lose Value